The second project of my Mechatronics education was to build a cart that could sens and record acceleration data and predict the carts path. The acceleration data also needed to be collected for post processing and analysis. My part of the project consisted of programming the Arduino and creating the python Gui and data analysis program. It also consited of designing and building of the hardware.
The setup can be seen in Figure 1. The cart gets accelerated over a predetermined path until it reaches the ramp. After it reaches the ramp the carts needs to give a visual indication if the carts turning point is between point a and b or not. This indication has to be done before the return point of the cart is reached.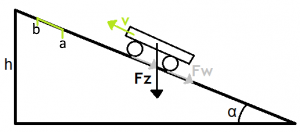
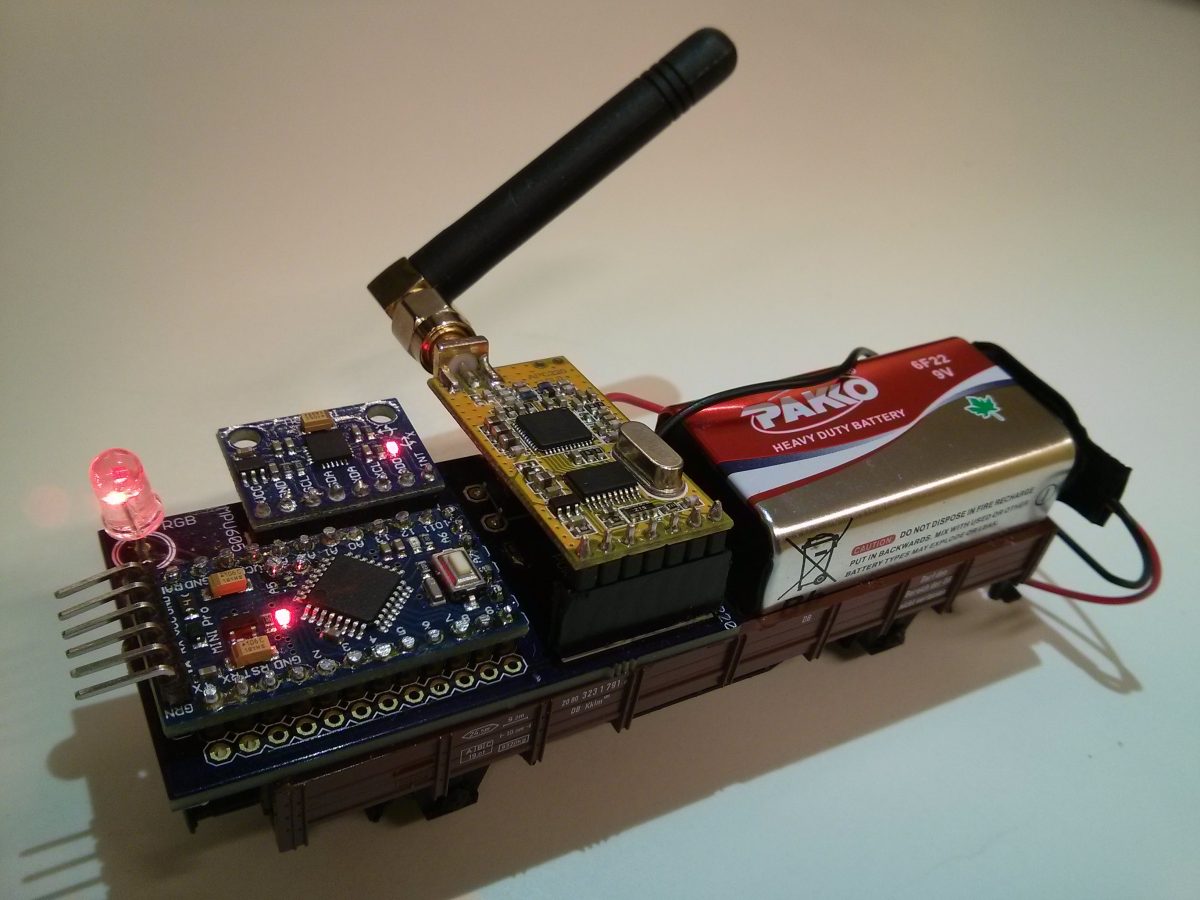
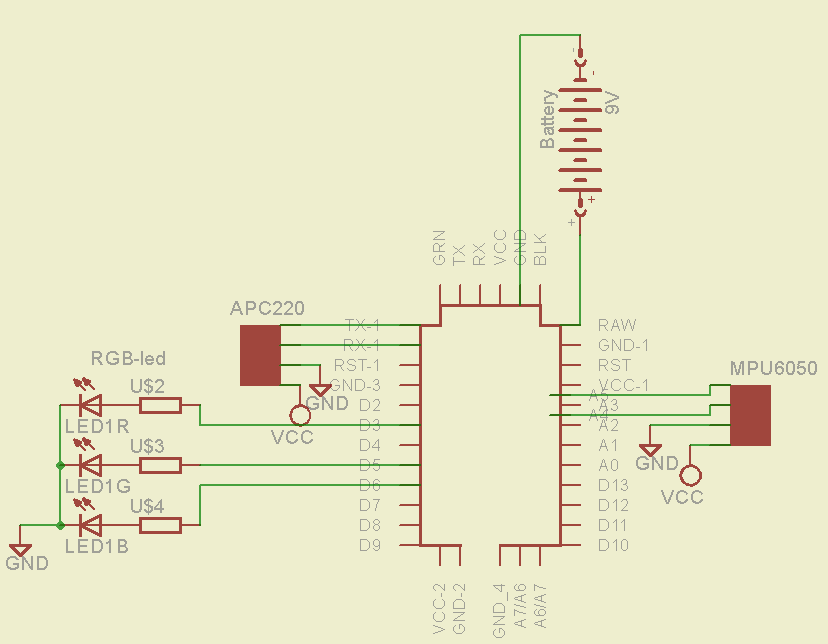
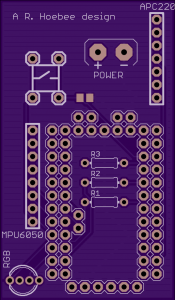
The on-board hardware consists of a battery, a RGB-led, a Arduino Pro mini, a MPU6050 and a APC220. This can be seen in Figure 2. This electric circuit was turned into a PCB as can be seen in Figure 3. The MPU6050 consists of a 3-axis accelerometer and a 3-axis gyroscope, for this project only the accelerometer was used. The APC220 is a transceiver operating on 433Mhz, which is used to send and receive serial data from the Arduino to the PC. Because of the Arduino’s limited processing power and the need for a quick calculation, the Arduino uses two setpoints to determine if the carts return point is between a and b. The setpoints are compared to the measured acceleration of the cart during the acceleration phase. These two setpoint where calculated in advance. This was possible due to the fact that the tracks position was known and the friction coefficients where derived from a test setup. If the cart was not able to reach point a, then the RGB-led would turn orangje. If the cart would pass a but not b the RGB-led would turn green and if the cart would pass point b the RGB-led would turn red.
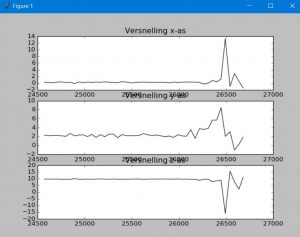
The acceleration data also needed to be recorded for later use. All groups decided to store their data onto an SD-card. Except for our group, we decided to transmit the data to a pc. We did this so that in order to processes the data the cart did not needed to be removed from the setup and analysis of the data could be a lot quicker. The pc used a python script to record the data from the card and store it in a CSV file. This CSV file could also be read by python so that recorded session could be easily analysed. See Figure 4 for recorded session. A other benefit of using python and wireless data acquisition is that it was also possible to give a life plot of the data.